I love Saturdays, but Saturdays with college football are far and away the best. There are few greater joys than your team scoring a win — well, aside from the team you bet on scoring a win. But if you’re struggling to find winners on Saturdays, the betting experts and college football betting model available here at OddsShopper can help you increase your ROI by finding positive expected value (+EV). Let’s dive into our discussion about how to be a profitable college football bettor by using a +EV betting strategy.
This article will guide you through both market-based and projections-based strategies to find +EV bets on college football sides and totals. We’ll delve deeper into these concepts shortly, but essentially, the differences revolve around the types of data used to estimate probability. Similar methods can be applied to betting on college football player props (if they’re still legal in your state). Without further ado, let’s discuss how to become a successful college football bettor.
How to Be a Profitable College Football Bettor: +EV Betting Strategy
How to Profit on College Football Bets: Find Positive EV
No matter what sport you’re betting on, if you want to be able to profit over the long term, you’ll need a consistent method for calculating expected value (EV). Expected value is simply how profitable you think a bet will be over the long term.
To find expected value, you need to be able to calculate the probability of the outcome you’re wagering on. Let’s say you wanted to bet on Tennessee to beat Vanderbilt, and you give the Volunteers a, say, 90% chance of winning.
Your expected value would be the difference between what the sportsbooks say Tennessee’s win probability is and what your estimated value is. Expected value can be either positive (which suggests you should place the bet) or negative (which suggests you shouldn’t).
If the Volunteers were a -200 (66.7%) moneyline favorite, you’d have 23.3% of positive expected value, or +EV; if they were -2000 (95.4%), you’d have 5.4% of negative expected value. You can then use those numbers to estimate your return on investment (ROI).
To calculate the probability of an outcome in college football — and, really, in any sport — you can apply either a market-based or projections-based approach. Let’s dive into how you can calculate those market- and projections-based value estimates.
How to Find Market-Based College Football Side & Total Bets
If you’ve seen ESPN’s win probability estimates in the past, you know what college football projections are. Let’s revisit the Tennessee and Vanderbilt example from above. ESPN gives the Commodores a slim 15% chance of winning based upon their power index, game location and whatever factors they consider.
I’ll dive into the metrics I consider when making college football projections, but first, let’s talk about an easier way to place winning college football bets: a market-based approach. Because there are so many different sportsbooks, they’ll rarely have the same number, and you can use the market consensus to find (and beat) outlier numbers.
Here’s an example. Suppose Sportsbook A lists Tennessee at -250 on the moneyline. Sportsbook B lists them at -500, and Sportsbook C is hanging a -600. Sportsbook D, which you know is sharp because of their high limits and low hold, has Tennessee posted at -450.
Congratulations! You’ve found a big-time market inefficiency. If it’s not obvious, let’s turn those numbers into statements to make things clearer.
- Sportsbook A: Tennessee has a 71.4% chance of winning.
- Sportsbook B: Tennessee has an 83.3% chance of winning.
- Sportsbook C: Tennessee has an 85.7% chance of winning.
- Sportsbook D: Tennessee has an 81.8% chance of winning.
As you can see, it should be obvious that Sportsbook A has made a mistake. The market consensus points to a much higher chance of Tennessee winning on Saturday than their odds suggest, making them a sharp bet on the moneyline, especially with Sportsbook D charging 10% less than Sportsbook A.
Using Portfolio EV to Find Market-Based College Football Bets
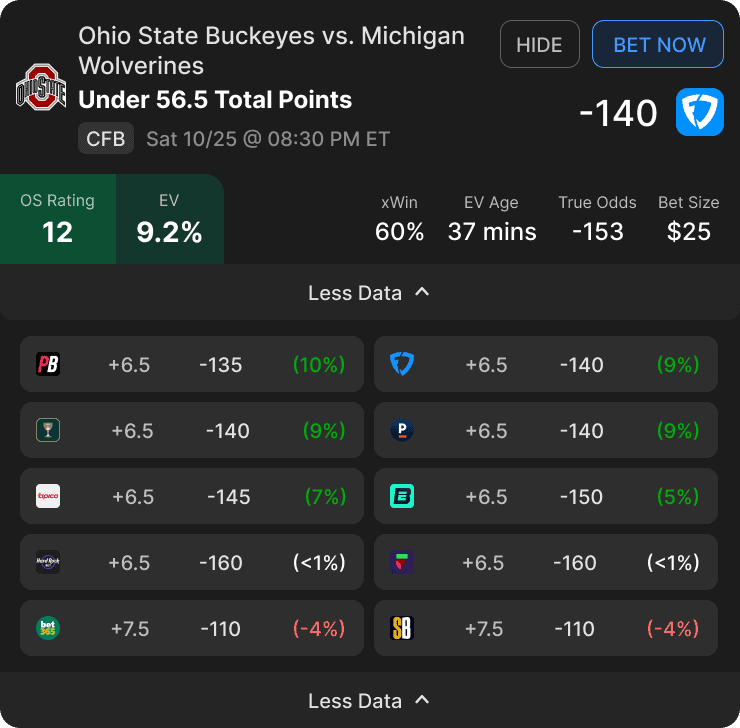
But knowing which books are sharper than others — and knowing at what point your edge overcomes the hold each book, even Pinnacle, a sharp book, is pocketing from your wager — isn’t easy. Fortunately, Portfolio EV+EV betting model does the hard work for you. Let’s take a quick look at an example wager and how our product team describes each of the key terms.
Bet Size: The recommended bet size as a percentage of your bankroll. This metric is based on a fractional Kelly Criterion approach that leads to a reasonable balance of minimizing risk of ruin while maximizing potential reward.
EV: An abbreviation for “expected value,” this metric estimates the long-term profitability of a wager by taking into account the probabilities/payouts associated with each potential outcome.
xWin: The probability of winning the bet implied by the Sharp Sportsbook Algorithm true odds.
OS Rating: The OS rating provides a rating for each +EV bet. An OS rating above 20 signifies an exceptional bet. Ratings between 10 and 20 are highly favorable bets. Finally, a rating between 0 and 10 indicates a solid bet. We factor in the EV, expected win, bet size, and negative geometric drag to calculate this rating.
Hold: The synthetic hold across the entire market, which is the loss a bettor would sustain if he bet both sides of the market to win equal amounts. The larger the hold, the more difficult it is to beat that market. While uncommon, a negative synthetic hold is possible. Negative synthetic holds are arbitrage situations (also known as arbs) where a bettor can guarantee a profit by booking both sides.
True Odds: Odds that represent the real statistical probability of any outcome in a particular sporting event.
How to Find Projection-Based College Football Bets
Some people prefer to handicap games themselves and make projections-based bets. Others like to blend a market- and projection-based approach. Either way, if you’re hoping to break things down yourself, a basic understanding of college football stats is pivotal, and unlike sports with longer seasons, we often need to dig deeper than simple averages and trends.
In this article, I’ll walk through the most basic statistic to use when handicapping college football: yards. Because points are variable (and can come on fluke plays), yardage is a far better indicator of weekly success. We’ll also talk about some advanced stats to supplement (or replace!) yardage in your college football betting strategy as well as how to handle player injuries.
Football is a Game of Yards | +EV College Football Betting Strategy
While advanced stats like expected points added (EPA) are commonly accessible (and free) for the NFL, the same can’t be said for college football. There are some sites and analysts that post them, but if you don’t have access to their data sources, working with yardage can be an acceptable alternative.
The reason why I recommend starting with yardage, both generated and allowed, is because points are likelier to be subject to variance. A fluke pick-six — or a fluke turnover near the goal line — can result in six points that shouldn’t be credited to an offense. Likewise, those plays shouldn’t be blamed on a defense.
Yardage is generally a more predictable stat in terms of team success, especially on a per play, not per game, basis. The ability to consistently generate yards on offense — and consistently limit them on defense — generally offers more predictive insight than other actual stats, simply because it’s a larger sample.
Let’s look at some examples. Heading into the College Football National Championship Game for the 2023 season, Michigan ranked 30th in yards per play (6) and third in yards allowed per play (4.1). Washington ranked fourth in yards per play (7.1) but 54th in yards allowed (5.4). The strength-on-strength matchup between Washington’s offense and Michigan’s defense would likely determine the contest.
But to get deeper, Michigan’s defense ranked third in yards allowed per pass attempt (5.7). Washington’s passing offense ranked 12th (9), a slightly less impressive ranking (and slightly less significant difference compared to the NCAA average) than Michigan’s. So, what happened?
Michigan’s massive defensive edge resulted in the Wolverines holding the Huskies to 4.3 yards per play and 5 yards per pass attempt. Washington’s defensive flaws presented an opportunity for Michigan’s offense, too, which racked up 7.8 yards per play. The Wolverines won by 21.
Know the Best Advanced Stats | +EV College Football Betting Strategy
While not every advanced stat is easily accessible, leading to yardage becoming a great alternative for entry-level bettors, there are some stats aside from my favorite, expected points added (EPA), that can help you build a profitable college football betting card.
High-variance explosive plays often determine outcomes in college football, and teams that are capable of producing more of them (or allowing few of them) will have a leg up. In 2013, teams that won the explosive play battle won the game a whopping 86% of the time.
Of course, explosive plays lead to big yardage, which is factored into yard per play data. Still, looking specifically at explosive play data can help you identify teams that generate more high-value yardage than teams that simply rack up yards without finding paydirt.
Another useful and related advanced stat to consider for your college football betting strategy is the rate at which a team finishes drives (or, again, the rate at which they allow other teams to finish their drives). It’s great to target teams that consistently generate yards, but if they always stall out in the red zone, those yards are less valuable than if they actually finished their drives
A good way to calculate how well a team finishes their drives is to look at how many points they average per drive inside the 40-yard line. This will also give you some insight into their special teams, as teams that convert their field-goal and extra-point attempts will necessarily perform better in this metric than those who don’t.
How to Use Expected Points Added (EPA) | +EV College Football Betting Strategy
The above numbers are great because they tell us what actually happened. But, in the case of a fluky completion or fumble near the goal line, actual stats can be limited. They don’t tell us what should’ve happened, which is important when hoping to estimate the probability of outcomes over the long term.
Knowing what should’ve (or what was likeliest) to have happened in the past is important to forming an accurate baseline when estimating the range of outcomes for a future game. Expected points added (EPA) gives us some insight into what should’ve happened. Generally, offenses can add expected points by moving the ball closer to the goal line (at a rate fast enough to improve their odds of a first down — a two-yard gain on 1st and 10 or 3rd and 6 won’t help!), recording a first down or actually crossing the goal line. Defenses can subtract expected points by preventing the offense from achieving those ends.
The value of those yards is also staggered by where a team finds itself on the field. A two-yard gain on your opponent’s five-yard line is obviously more valuable than a two-yard gain on your own five-yard line, and the metric values those plays accordingly. This rewards offenses that succeed in the red zone while punishing those that do not. It also means that teams who benefit from lucky turnovers, start in the opponent’s red zone, and score, don’t receive as much of a boost.
Do Your Homework on Injuries | +EV College Football Betting Strategy
One way to find an edge on the sportsbooks is to get a better understand of injuries — or simply to react faster to injury news than they do. But because college football isn’t regulated the same way that professional football is, largely because these are student athletes, not professional ones, teams don’t have to disclose injuries in the same way.
If you can correctly guess whether a player will miss the next week’s action before the market does — or you can guess when they’ll return correctly — you may be able to find an edge on the books. That said, you’ll have to know how much that player is worth in terms of points (or yards, or expected points, etc.).
You can estimate a player’s value by looking at their stats, like passing efficiency and EPA, which you can find at College Football Data. Of course, just because a player is out doesn’t mean their team doesn’t have a backup, so you’re really trying to figure out how much they’re worth relative to their backup.
Getting an edge on the books with injury news is hard, but keeping a close eye on what team beat reporters are saying, what (if anything) players are posting on social media and, of course, what coaches feel comfortable letting slip to the press can all help you find positive expected value.


