So you want to start making money on the NBA. Maybe you’ve been an NBA bettor for a while but haven’t seen the returns you wanted — or maybe you’re just now getting into betting on the NBA. You’re in the right place: the betting experts and NBA betting tools available here at OddsShopper can help. Let’s dive into our discussion of how to profit on the NBA.
There are a wide variety of markets at your disposal when it comes to NBA betting, so I’ve split this article into a series of a few parts — sides and totals, player props and first basket wagers.
The gist is that OddsShopper can help you improve your ROI by finding positive expected value (+EV).
If you’re still confused, we have other Betting 101 posts for you to check out, and if you’re hungry for more basketball action, check out our NBA betting tools or our NBA betting promos!
How to be a Profitable NBA Bettor: Finding Positive EV
How to Profit on NBA Sides & Totals | Finding Positive EV
There is no one right answer for how to profit on sides and total wagers in the NBA. A number of statistics are useful to consider, but so are public betting splits and injuries. Let’s tackle each topic one by one as we discuss how to become a profitable NBA bettor. You may already be familiar with some of these concepts in NBA betting, but understanding how sharp bettors use them to their advantage is key. But before we get into some of the best methods to make projections, let’s talk about Portfolio EV’s market-based approach to finding positive expected value (+EV) on the NBA.
How to Use OddsShopper’s Model to Find Positive EV
There are two ways to go about formulating a betting strategy for any sport. You can take a projection-based approach, in which you use your own projections, usually based on stats and available personnel, to calculate the odds of a given bet winning. You can also take a market-based approach, in which you use the odds available at different sportsbooks to calculate the odds of a given bet winning.
Projection-based models are easiest for new bettors to understand. They’re not much different from those used by fantasy sports websites to estimate how well your team will perform on a given week. However, market-based models can be harder for bettors to understand. They rely on the assumption that some odds (and some action bet on those odds) are sharper than others. For example, if Pinnacle, which is widely considered a sharp book due to its userbase, has a bet priced at -150, but DraftKings Sportsbook, which is considered a public book, lists the same bet at +150 — it’s usually smart to take that bet.
But knowing which books are sharper than others — and knowing at what point your edge overcomes the hold each book, even Pinnacle, is pocketing from your wager — can be difficult. That’s why Portfolio EV does the hard work for you. Let’s take a quick look at an example wager and how our product team describes each of the key terms.
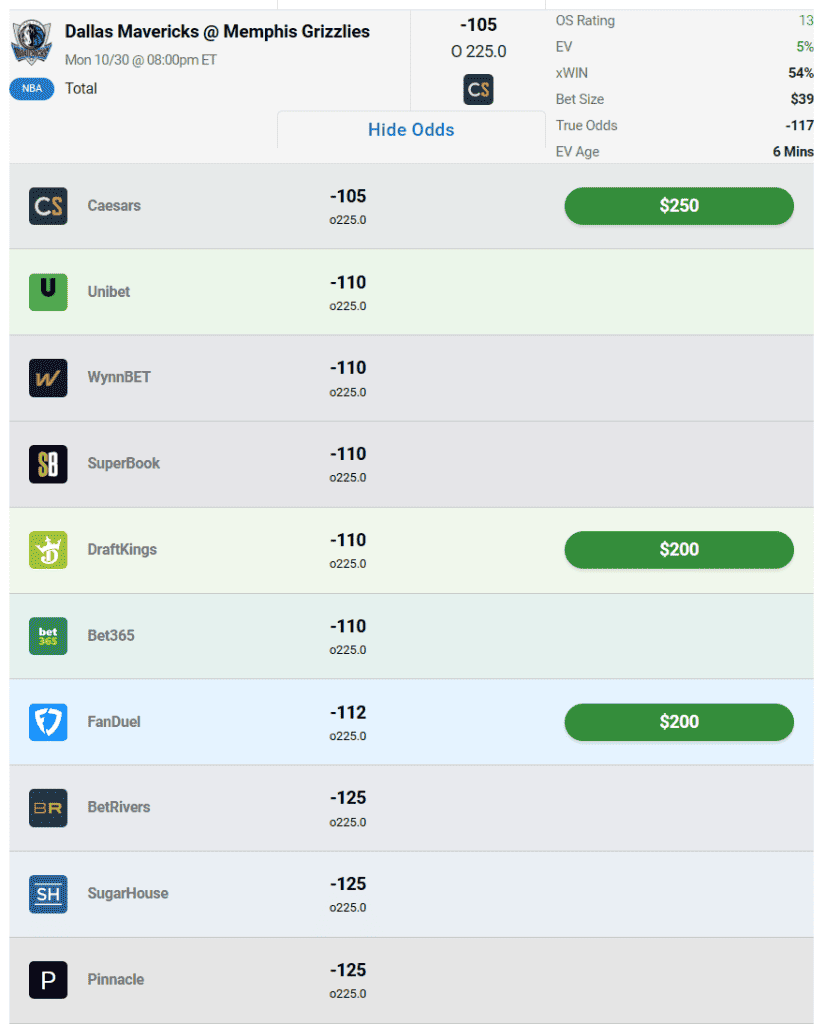
Bet Size: The recommended bet size as a percentage of your bankroll. This metric is based on a fractional Kelly Criterion approach that leads to a reasonable balance of minimizing risk of ruin while maximizing potential reward.
EV: An abbreviation for “expected value,” this metric estimates the long-term profitability of a wager by taking into account the probabilities/payouts associated with each potential outcome.
xWin: The probability of winning the bet implied by the Sharp Sportsbook Algorithm true odds.
OS Rating: The OS rating provides a rating for each +EV bet. An OS rating above 20 signifies an exceptional bet. Ratings between 10 and 20 are highly favorable bets. Finally, a rating between 0 and 10 indicates a solid bet. We factor in the EV, expected win, bet size, and negative geometric drag to calculate this rating.
Hold: The synthetic hold across the entire market, which is the loss a bettor would sustain if he bet both sides of the market to win equal amounts. The larger the hold, the more difficult it is to beat that market. While uncommon, a negative synthetic hold is possible.
True Odds: Odds that represent the real statistical probability of any outcome in a particular sporting event.
How to Use Advanced NBA Statistics | How to Find Positive EV on the NBA
So what advanced statistics do NBA bettors use when making projections for side and total markets? Several, but none stand out more than efficiency rating and pace. Pace is somewhat tricky to calculate because possessions are harder to quantify in basketball than in football or soccer. The basic rule is this: field goal attempts minus offensive rebounds plus turnovers and free throws (multiplied by some decimal to adjust for the fact that not every free throw is a single possession). A team’s pace is simply how many possessions they average per game.
Efficiency rating builds upon pace. It measures how much a given team scores or allows per a set number of possessions. It’s either expressed in terms of points per 100 possessions, e.g. 101.8, or in terms of points per a single possession, e.g. 1.018. From there, we can calculate net rating, or the difference between a team’s offensive and defensive efficiency. You can find that data here.
There are still other metrics to discuss, however. The four factors are another crucial set of data points to use when handicapping side and total markets. The four factors are effective field goal percentage, free throw attempt rate, turnover rate and offensive rebound rate. These accomplish a similar goal to the efficiency and pace metrics laid out above — they tell you (1) how often a team scores and (2) how often they possess the ball, both of which are key to understanding how to profit on the NBA.
These advanced stats help you better understand a team’s performance. For example, the Atlanta Hawks may be averaging 122.8 points per game, but that could be because they play at a fast pace moreso than because they’re an efficient offense. Likewise, if the Denver Nuggets are allowing only 101.8 points per game, that could come down to slow pacing rather than efficient defense. Understanding net rating can help you more efficiently compare two teams.
Further, pace and efficiency can help you understand how to approach a total. If the total between two efficient offenses is super high, consider the pacing — if the two teams (or even one of them!) are playing at a slow pace, the market may be expecting too much scoring relative to what will happen. Likewise, if you’ve found an efficient defense catching a low total, consider whether they’re playing at a slow enough pace for the over or under to have the most value.
How to Use NBA Public Betting Splits | How to Profit NBA
You’ve probably heard the saying, “Fade the public!” before. But what does it mean, and how do you do it? Well, the saying means to go against the grain — at least as far as what most recreational bettors are doing. Sportsbooks consider a variety of factors when evaluating the money that has come in on the given side of a market before deciding upon whether to adjust the line. In simple terms, they look at the handle, or the percentage of cash on each side of a wager, and the tickets, or the number of bets placed on each side of a wager. Understanding public betting splits is key to building a market-based approach to NBA betting.
We can draw some quick conclusions once we have information about the split between the handle and tickets. For example, if a book is reporting that 75% of the handle is on one side of the market — but that only 15% of the tickets are on that side — we know that a big-money bettor, who is more than likely sharp, has gotten exposure to that side. If a book reports that 60% of the tickets have come in on one side but that only 40% of the handle is behind those tickets, we can infer that the public is buying into that side.
So if you’re looking to “fade the public,” that means you’re playing the side that small-money wagerers, who are usually square, are buying into. Finding spots where sites are reporting plenty of tickets but a low handle share supporting them is the best way to do so.
Finding accurate information about public betting splits can be difficult. Pregame offers plenty of well-maintained information about public betting splits, but it’s a somewhat biased sample since the site doesn’t track raw data from the books. Vegas Insider offers paywalled betting splits from DraftKings Sportsbook. Some books, like BetMGM and bet365, will release betting split information via press releases that you’ll often find picked up by websites like ours.
How to Use NBA Injury Reports | How to Profit NBA
While sharp money can move the NBA betting lines, injuries often do so, too. There is a bit of correlation — sharp bettors will often try to exploit numbers before injury news breaks to the broader public, but even once it does, some books can be slow to adjust the original number. Bettors taking advantage of some breaking news often move the line themselves in a phenomenon called “steaming,” which, if you’re too late, is a surefire answer to the question of how to not profit on the NBA.
However, it’s worth considering what the ramifications of a given player’s absence — or potential absence — truly are. It’s overly simplisitic to rush to fade a team missing a big-name player. For instance, the Minnesota Timberwolves had a higher winning percentage. For example, the Minnesota Timberwolves won 66.7% of their games without Rudy Gobert in 2022-23 but only 48.7% of their games with him.
So what are some quick rules of thumb for what to do when a given archetype of player is out? If they’re a positive defensive contributor but a negative offensive one, the over is often a good investment. If the inverse is true, the under comes into play. If a player is both a positive defensive and offensive contributor, backing their opponent is often sharp; if the inverse is true, as was the case with Gobert for much of 2022-23, backing the team with the injured player can prove sharp.
Few sports are as chaotic as the NBA when it comes to player injuries. Back-to-back games and load management make handicapping injuries just as important as handicapping actual games. While following along with teams’ injury reports is a good start, sharp NBA bettors can pick out trends, like whether “questionable” is really 50/50 or closer to 25/75 with given teams and players, and whether certain players are likelier to sit on the second leg of a back-to-back set.
