Like most Americans, I love the NFL. I also love betting on the NFL, so I’m quite thankful doing so is legal now. If you’re here, you probably like betting on the NFL too — but are you a profitable NFL bettor? Even if you are, you can probably increase our returns with the tips below. Let’s dive into how to be a profitable NFL bettor as we discuss a betting strategy centered around positive expected value (+EV).
This article will walk you through both market-based and projections-based ways to arrive at +EV bets on NFL sides and totals. We’ll get more into what those terms mean later, but the short version is that these methods concern the types of data you’re looking at to estimate the probability of a given outcome. You can use the same approach as an NFL player prop betting strategy, which you can read about at that link. Without further ado, it’s time to discuss how to be a profitable NFL bettor.
How to Be a Profitable NFL Bettor: +EV Betting Strategy

👉 Check Out the FREE Expert Picks »
The Free Picks on Tails are your shortcuts to smarter bets … no signup, no strings. Here you will find a bunch of FREE expert picks, updated daily.
How to Profit on NFL Bets: Find Positive EV
Regardless of which sport you’re betting on, if you want to be a profitable better over the long term, you need a consistent method to calculate expected value (EV). Expected value is, in simple terms, an estimate of how profitable you expect a bet will be over the long term.

If you want to calculate expected value, you first need to calculate the probability of the bet in question winning. Let’s take an example — say the Miami Dolphins were visiting the New England Patriots, and you estimated that the home team had a 50% chance of winning.
In this case, you could find expected value by taking the difference between what the sportsbooks believed New England’s win probability to be and what you believed it to be. If your expected value is positive, congratulations — you’ve found a good bet! If it’s neutral or negative, well, not so much.
To take it a step further, if the Patriots were a +200 (33.3%) home underdog, you would have 16.7% of positive expected value. If they were a -200 (66.7%) home favorite, you’d have 16.7% of negative expected value. You can then estimate your return on investment with this information.
To calculate the probability of a bet winning in the NFL (or any sport, really), you can apply either a market-based or projections-based approach. Let’s dive into how you can calculate those market- and projections-based value estimates.
How to Find Market-Based NFL Bets
You should already be familiar with projections-based approaches to probability. If you’ve scrolled through the scores at ESPN and seen their win probability estimates, you know what I’m talking about. To revisit our Miami and New England example, they may say the Patriots have a 45% chance of winning. Using that estimate would be employing a projections-based approach.
We’ll discuss the numbers that I use when constructing NFL projections later, but before we dive into that, let’s discuss an easier way to do things: employing a market-based approach. Since there are so many different sportsbooks, you’ll rarely see them taking action on bets at the same price, allowing you to use the market consensus to find (and beat) outlier numbers.
Let’s say that Sportsbook A lists New England at +150 on the moneyline. Sportsbook B lists them at +100, and Sportsbook C is hanging a +110. Sportsbook D, which you know is sharp because of their high limits and low hold, has New England posted at +120.
Congratulations! You’ve found a big-time market inefficiency. If it’s not obvious, let’s turn those numbers into statements to make things clearer.
- Sportsbook A: New England has a 40% chance of winning.
- Sportsbook B: New England has a 50% chance of winning.
- Sportsbook C: New England has an 47.6% chance of winning.
- Sportsbook D: New England has an 45.5% chance of winning.
As you can see, it should be obvious that Sportsbook A has screwed up. The market consensus points to a much higher chance of New England beating Miami than their odds suggest. Through a market-based NFL betting strategy, we can tell that the Patriots are a sharp bet on the moneyline, especially with Sportsbook D charging 5.5% less than Sportsbook A.
Using Portfolio EV to Find Market-Based NFL Bets
Knowing which books are sharper than others — and knowing at what point your edge overcomes the hold each book, even Pinnacle, a sharp book, is pocketing from your wager — isn’t easy. Fortunately, Portfolio EV does the hard work for you. Let’s take a quick look at an example wager and how our product team describes each of the key terms.
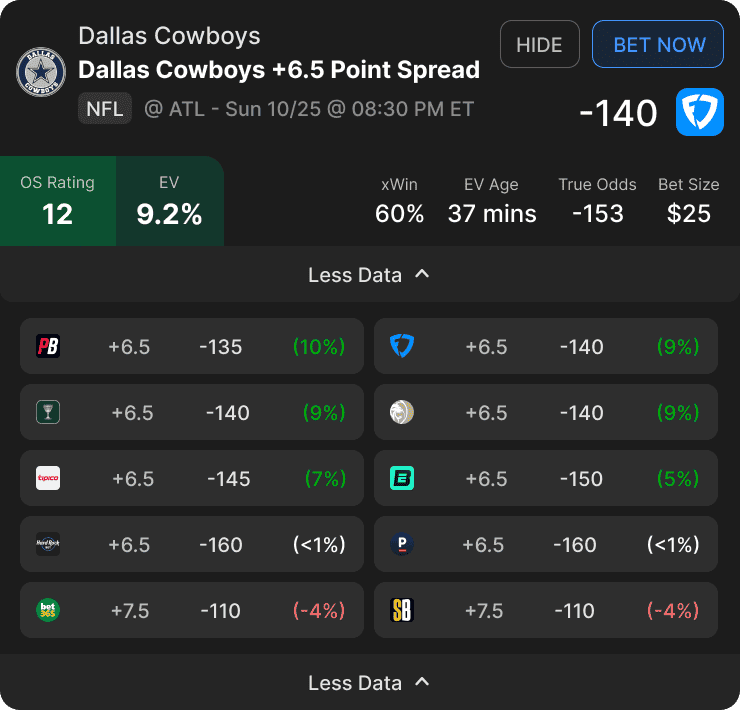
Bet Size: The recommended bet size as a percentage of your bankroll. This metric is based on a fractional Kelly Criterion approach that leads to a reasonable balance of minimizing risk of ruin while maximizing potential reward.
EV: An abbreviation for “expected value,” this metric estimates the long-term profitability of a wager by taking into account the probabilities/payouts associated with each potential outcome.
xWin: The probability of winning the bet implied by the Sharp Sportsbook Algorithm true odds.
OS Rating: The OS rating provides a rating for each +EV bet. An OS rating above 20 signifies an exceptional bet. Ratings between 10 and 20 are highly favorable bets. Finally, a rating between 0 and 10 indicates a solid bet. We factor in the EV, expected win, bet size, and negative geometric drag to calculate this rating.
Hold: The synthetic hold across the entire market, which is the loss a bettor would sustain if he bet both sides of the market to win equal amounts. The larger the hold, the more difficult it is to beat that market. While uncommon, a negative synthetic hold is possible. Negative synthetic holds are arbitrage situations (also known as arbs) where a bettor can guarantee a profit by booking both sides.
True Odds: Odds that represent the real statistical probability of any outcome in a particular sporting event.
How to Find Projection-Based NFL Bets
Why You Should Use Expected Points Added (EPA) | +EV NFL Betting Strategy
Now let’s talk about projections-based methods for identifying +EV NFL bets. Stats like points per game, points per play, yards per game — and even points allowed per game, points allowed per play, and yards allowed per game — are useful, but they simply tell us what actually happened in a game. They don’t tell us what should’ve happened.
Knowing what should’ve (or what was likeliest) to have happened in the past is important to forming an accurate baseline when estimating the range of outcomes for a future game, which itself is pivotal to a profitable NFL betting strategy. For instance, in Super Bowl LVIII, the San Francisco 49ers moved the ball downfield with ease — but they got unlucky with multiple lost fumbles and a missed PAT. But how can we tell whether that bad luck cost them the game, or that it prevented what should’ve happened from happening?
Expected points added (EPA) gives us some insight into what should’ve happened. Generally, offenses can add expected points by moving the ball closer to the goal line (at a rate fast enough to improve their odds of a first down — a two-yard gain on 1st and 10 or 3rd and 6 won’t help!), recording a first down or actually crossing the goal line. Defenses can subtract expected points by preventing the offense from achieving those ends. You can view EPA stats at RBSDM.
The value of those yards is also staggered by where a team finds itself on the field. A two-yard gain on your opponent’s five-yard line is obviously more valuable than a two-yard gain on your own five-yard line, and the metric values those plays accordingly. This rewards offenses that succeed in the red zone while punishing those that do not. It also means that teams who benefit from lucky turnovers, start in the opponent’s red zone, and score, don’t receive as much of a boost.
Although the 49ers lost Super Bowl LVIII, you wouldn’t know it by comparing their EPA to Kansas City’s — San Francisco averaged 0.004 EPA per play while Kansas City averaged -0.019. These numbers suggest that, over the long term, the 49ers would win Super Bowl LVIII more often than they would lose it. If we were simply using actual points scored or yards gained, that reality would be less obvious.
How to Use Expected Points Added | +EV NFL Betting Strategy
Now that you have a basic understanding of what expected points and expected points added are, let’s get into how I recommend applying them when handicapping NFL sides and totals. To illustrate this point, let’s stick with our example of Super Bowl LVIII. The sportsbooks opened the bidding with the 49ers listed as favorites, and they closed between -120 and -130 on the moneyline, depending on where you looked.
Many media pundits questioned why the 49ers were favored. They were playing against Patrick Mahomes, after all. Didn’t they know about Mahomes Magic (and, well, Taylor Swift)?
Heading into the big game, the 49ers were far and away the better team in terms of EPA. From Week 1 through the Conference Championships, San Francisco led in EPA per play (0.181) by a wide margin, pacing the next-best xxx by xxx. Kansas City, who ranked 10th (0.034), averaged 0.147 fewer EPA per play — good for a difference of almost two scores touchdown over a 60-play sample.
That said, Kansas City did have a slight edge defensively, ranking fifth (-0.076) while San Francisco ranked 14th (-0.035), but that 0.041 difference wasn’t close to offsetting the edge the 49ers held on offense, bringing their advantage over a 60-play sample to one score but still over a touchdown.
Even this basic, bare-bones application of EPA would’ve suggested an edge on San Francisco that, barring bad fumble luck and a missed PAT, would’ve yielded bettors a positive return. Of course, the margin was still tight enough that a Kansas City was well within the range of outcomes, but, again, over the long term, the San Francisco’s EPA advantage suggests their victory was likelier than the odds suggested.
Other NFL Stats to Consider | +EV NFL Betting Strategy
The short nature of the NFL season makes forming a meaningful sample size difficult. Even by the Super Bowl, all teams will have played just 17 regular-season games and between three and four playoff games. While EPA gets more and more accurate over the course of the season, other stats can help you bridge the gap until then.
Last year’s EPA metrics (or a rolling average) are generally a good place to look, but they’re most useful for teams with a lot of continuity. Coaching and roster changes can easily render those rolling stats useless, as can injuries. Still, if you’re going to use EPA early in the year, I advise doing so with some of last year’s production baked in.
If a team has made significant roster changes (or a player gets hurt), it can be worth it to evaluate individual players to try and quantify the effect of their presence or absence. For quarterbacks, I advise just using EPA, which is also credited to them at RBSDM. A rolling average can be especially helpful here.
But for other positions and position groupings, things get a bit more complicated. DVOA, which is also tracked for ball-carriers, can help us evaluate quarterbacks and skill-position players. PFF grades can help, too. When evaluating contributors in the trenches, I look at win rate (which is tracked, both individually and collectively, for pass blocking, run blocking, pass rushing and run stopping) and line yards (which is tracked collectively).
How to Use NFL Injury Reports | +EV NFL Betting Strategy
Another related source of edge can be the NFL injury report. Because football is such a physical game, players often miss time, and if we can quantify the likelihood of their absence (or presence) and the difference in quality between them and their backup, we may be able to find an edge, especially early in the week.
For instance, let’s say that Patrick Mahomes suffered an injury in the AFC Championship game and was listed as a game-time-decision headed into Super Bowl LVIII, leaving the 49ers as -200 moneyline favorites. In order to find an edge against that line, we’d need to know both how likely it would be that Mahomes plays and how meaningful his absence is.
Estimating the Value of a Specific Player
To calculate the difference between Mahomes and his backup, we could compare him to his backup, which, for Super Bowl LVIII, was Blaine Gabbert. Using a rolling EPA average from when Mahomes entered the league in 2017, we can see that Mahomes’ EPA per play (0.273) far outpaced Gabbert’s (-0.166), giving us a difference of 0.439 EPA per play.
Of course, play-calling, teammate quality and flat-out playbook knowledge are all variables at play here. So is the reality that if Mahomes were playing through an injury, he would probably be less efficient than his usual self. Those factors all tell us that the 0.439 is a very imperfect estimate, but still, it gives us a ballpark figure to consider when evaluating the consequences of Mahomes’ possible absence.
Estimating Whether that Specific Player Plays
The far more difficult part of this process is to calculate the probability that Mahomes, or any player, will actually suit up. The NFL recommends that the questionable tag be applied for 50-50 situations and the doubtful tag be applied in 25-75 (probable used to mean 75-25), but players are often on the wrong or right side of questionable. It’s rarely 50-50.
Teams and coaches are often tight-lipped about the status of their injured plays, especially when the season is on the line. Still, we can glean all sorts of information from the tape of the injury, what medical professionals are saying about it, how much that player practiced during the week and more. Local beat reporters are a great source of insight here, too.
A few quick rules of thumb that I use when estimating whether a player will suit up: if a questionable player does not participate in practice all week, they’re probably not playing, especially if they are not a veteran; conversely, if a questionable player is a limited participant in practice all week (or is a full participant in the last practice of the week). they’re probably playing.