So, you want to bet on college football player props. Although they aren’t available in every state, they are available in a few. If you’re just starting out with sports betting, we have other Betting 101 posts for you to check out, and I recommend that you check out Portfolio EV college football bets while you’re here! Anyway, let’s talk about how to bet on college football player props as I dish out my tips, strategy and expert advice.
How to Bet on College Football Player Props: Strategy & Expert Advice
Figure Out if You Can Bet on College Football Player Props
Some states allow you to bet on college football player props. Others don’t. For the most up-to-date information on where you can bet on college football player props, check out college player props legal states page. As of publication, the following states allowed betting on college player props in some capacity:
- Arkansas
- Connecticut
- Illinois
- Indiana
- Iowa
- Kansas
- Kentucky
- Maine
- Michigan
- New Hampshire
- New Jersey
- North Carolina
- Rhode Island
- Washington D.C.
- Wyoming
If you navigate to the college football betting page at your sportsbook and you don’t see player props listed, chances are that’s because (a) you’re in a state where they aren’t legal, (b) it’s too early in the week for prop lines to be posted, or (c) the game is too low-profile for books to post prop lines.
How to Bet on College Football Player Props
Again, to start betting on college football player props, you must make sure they’re available at your sportsbooks. Navigate to the “college football” tab and click on your chosen game to start betting on them. You’ll usually see college football player props divided into passing, receiving and rushing categories.
Those are the basics of betting on college football player props. Of course, if you’re smart, you’re probably wondering how you should bet on college football player props in a way that will actually make a profit. Consistency over a large sample is necessary for any college football player prop betting strategy worth its salt, and the best way to attain that consistency is to develop a method through which to estimate expected value (EV).
Expected value is simply how much of a return you expect to make on a given bet, which you can estimate by calculating the difference in probability between the price posted at the books and either a market-based estimate or a player projections-based one.

If you think a bet wins more often than the books do, you think that bet has positive expected value, or +EV. Next, let’s discuss how to calculate market- and projections-based probabilities.
How to Find Market-Based College Football Player Prop Bets
Have you played fantasy college football before? It’s a lot less common than NFL fantasy football, but it still exists. Regardless, as long as you’ve played some form of fantasy sports, you’re familiar with projections. ESPN may tell you that a certain player is expected to generate 18.4 fantasy points because he’s projected for, say, 4.3 receptions, 93 receiving yards and 0.8 touchdowns.
Those numbers are generally estimated by using a combination of that player’s previous stats, his opponent’s stats and other factors. You could use those same projections to justify betting on that player to record over 89.5 receiving yards, for instance.
We’ll talk more about projections later, but first, let’s discuss market-based betting. Instead of using stats to estimate how many yards a given college football player will record — or, really, how likely it is for that player to generate X number of yards — we can use the market to accomplish something similar.
Here is an illustration. Sportsbook A lists your player’s receiving prop at 89.5 with the over priced at -110. Sportsbook B has the same over priced at -150, and Sportsbook C has that receiving prop at 94.5 with the over priced at -110. Sportsbook D, which you know posts sharp lines because they take a massive handle with relatively little hold, has the over 94.5 priced at -105.
In short — the market we just described is very inefficient. That inefficiency creates an opportunity for you to exploit. if you don’t see it, let’s restate the books’ lines in sentence form to make this clearer:
- Sportsbook A: The player has a 52.4% chance of recording at least 90 yards.
- Sportsbook B: The player has a 60% chance of recording at least 90 yards.
- Sportsbook C: The player has a 52.4% chance of recording at least 95 yards.
- Sportsbook D: The player has a 51.2% chance of recording at least 95 yards.
With all of that said, it should now be quite clear that Sportsbook A is hanging an off-market number. The market consensus points to a much higher chance of your player recording 90-plus yards than their odds suggest, making the over a sharp bet on their site, especially since Sportsbook D has better lines.
Using Portfolio EV to Find Market-Based College Football Player Prop Bets
But knowing which books are sharper than others — and knowing at what point your edge overcomes the hold each book, even Pinnacle, is pocketing from your wager — can be difficult. That’s why Portfolio EV does the hard work for you. Let’s take a quick look at an example wager and how our product team describes each of the key terms.
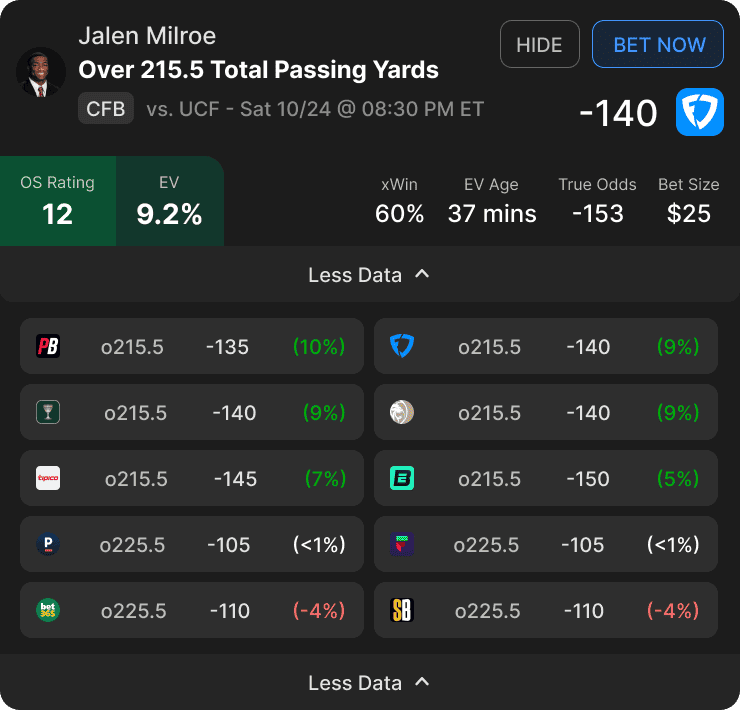
Bet Size: The recommended bet size as a percentage of your bankroll. This metric is based on a fractional Kelly Criterion approach that leads to a reasonable balance of minimizing risk of ruin while maximizing potential reward.
EV: An abbreviation for “expected value,” this metric estimates the long-term profitability of a wager by taking into account the probabilities/payouts associated with each potential outcome.
xWin: The probability of winning the bet implied by the Sharp Sportsbook Algorithm true odds.
OS Rating: The OS rating provides a rating for each +EV bet. An OS rating above 20 signifies an exceptional bet. Ratings between 10 and 20 are highly favorable bets. Finally, a rating between 0 and 10 indicates a solid bet. We factor in the EV, expected win, bet size, and negative geometric drag to calculate this rating.
Hold: The synthetic hold across the entire market, which is the loss a bettor would sustain if he bet both sides of the market to win equal amounts. The larger the hold, the more difficult it is to beat that market.
True Odds: Odds that represent the real statistical probability of any outcome in a particular sporting event.
How to Use Statistics in College Football Player Prop Betting Strategy
Now that we’ve run through how Portfolio EV’s market-based betting model works for college football player props, let’s discuss how you can use statistics for a projections-based approach to college football player prop betting. These notes can be useful even if you want to take a hybrid approach (which I personally recommend doing)!
But unlike college basketball and many other sports, the short nature of the football season makes leaning heavily on stats to project future stats a bit more complex. Ranges of outcomes tend to be, well, wider, which increases the importance of being able to understand how to use medians, averages and peripheral stats.
We’ll discuss a few different types of stats to consider when betting on college football, including traditional stats (also known as counting stats — generally, these are what you’re getting action on), efficiency stats, and, most importantly, volume stats.
Traditional Stats | Expert College Football Player Prop Advice
These stats are the ones you’re probably the most familiar with — and, ultimately, they’re the ones you’ll probably end up betting on. While some advanced stats like catch probability are useful to understand what should’ve happened, we’re all betting on what actually happens, so knowing about how we understand actual outcomes is crucial.
If you’re reading this article, you probably already have a basic understanding of passing yards, sacks and the like. I won’t both defining them here. The only note I’ll make is that you should understand what counts as a rushing or passing yard — for example, in college, a sack is tracked as a loss of rushing yards (and is credited to the player); in the NFL, a sack is credited as a loss of team passing yards (but isn’t credited to the player).
Beyond knowing what traditional stats are, you should have an understanding of means and medians if you’re hoping to make projections based upon them. Let’s say we’re six games into the season and a receiver is averaging 75 receiving yards per game. His receiving yardage prop for the next week opens at 55.
Based upon that player’s mean, or average, performance, you may see the 55 as a low-ball. But let’s dig a bit deeper. Say that player was averaging 75 yards per game with individual game totals of 150, 40 and 35. While his mean clocks in at 75, his median sits at just 40 — far less compelling. That would give you the same 17.5-yard edge, but this time, for the under.
I encourage you to think in terms of ranges of outcomes when attempting to project a player’s actual output. In this example, a 55-yard showing is easily within this player’s range of outcomes — but how likely is it? You can use a player’s production from previous seasons (or, better yet, their opportunity stats) to better estimate the probability of the outcomes within their range.
Opportunity Stats | Expert College Football Player Prop Advice
Opportunity stats, also known as volume stats, are, with some exceptions, mostly a subset of counting stats. These metrics can tell you how many chances a player got to generate yards or score touchdowns. The most obvious are carries and targets (which we can filter by location on the field to determine red-zone volume), but snap counts, snap shares, routes run and route participation rate all offer meaningful insight.
Obviously, players who see the field more tend to gain more yards and score more touchdowns, but red-zone filters, game situation splits, active teammate splits and volume shares can help us understand what a player’s role is on their team. For instance, a backup running back may see a ton of action if the starter gets injured or their team wins in a blowout, but if we know their usage came in those situations, we can better see their production as an outlier.
Even a team’s passing play percentage and rushing paly percentage can help us find value on the player prop markets. If we know that a team uses a run-heavy scheme, and we also know they’re massive favorites to win, we might be able to find some value on the under for their quarterback’s passing yardage props.
Efficiency Stats | Expert College Football Player Prop Advice
While it’s important to know about a player’s production in terms of their per-game average, the short nature of the college football season makes it even more important to understand what they average on a per-opportunity basis.
Early season games against low-quality opponents can skew per-game averages in either direction, as players may gain more yards per play than usual but log fewer opportunities than usual.
Most efficiency stats are pretty simple — they measure yards per touch (be it a reception, pass attempt or rush). However, passing efficiency is an important stat to understand as well, and it factors in a whole bunch more.
I use passing efficiency to assess the quality of quarterback play, which is pivotal to handicapping both receiver production and the production of a quarterback himself. Benching is much more common in college football, and if you’re trusting an inefficient passer to go over, you could be exposing yourself to more risk than you realize.
Portfolio EV College Football Tools & Tips
Looking for more college football betting advice? OddsShopper’s experts are here to break down this season — make sure to check out the rest of our college football articles. Still need more picks? Subscribe to Portfolio EV for daily +EV college football bets.