Few sweats are more enjoyable than those on NBA player props. Waiting for a player to get a final rebound — or hoping for that player to not get another one — is often more entertaining than hoping the game’s outcome falls your way. Each shot just means more, and each substitution becomes part of the action. If you’re still confused after this story, or you’re looking for guides to NBA sides and totals or first-basket wagers, we have other Betting 101 posts for you to check out. Make sure to check out our NBA betting tools or our NBA betting promos as well! Anyway, let’s talk about how to bet on NBA player props as I dish out my tips, strategy and expert advice.

How to Bet on NBA Player Props: Tips, Strategy & Expert Advice
You can become a profitable NBA player prop bettor through a variety of techniques. Most bettors like to use evaluate statistics, be they traditional, advanced or tracking. Injuries are also important to discuss. Let’s tackle each topic one by one as we discuss how to bet on NBA player props. You may already be familiar with some of these concepts in NBA betting, but understanding how sharp bettors use to their advantage is key. But before we get into some of the best methods to make NBA projections, let’s talk about OddsShopper’s market-based approach.
How to Use Portfolio EV
The most intuitive way for most people to understand sports betting is that you, the bettor, are taking advantage of your sports knowledge to outsmart the books. That’s sometimes the case, but what if I told you that don’t need to know anything about sports to be a profitable sports bettor?
There are two main methods for profitable sports betting, projections-based approaches or market-based approaches, and the latter one doesn’t force you to know anything other than how sportsbooks operate. Both approaches simply use different sets of information to generate the odds of a given bet winning to identify wagers with positive expected value, or +EV.
Projection-based models are easiest for new bettors to understand. They’re not much different from those used by fantasy sports websites to estimate how well your team will perform on a given week.
However, market-based models can be harder for bettors to understand. They rely on the assumption that some odds (and some action bet on those odds) are sharper than others. For example, if Pinnacle, which is widely considered a sharp book due to its userbase, has a bet priced at -150, but DraftKings Sportsbook, which is considered a public book, lists the same bet at +150 — it’s usually smart to take that bet.
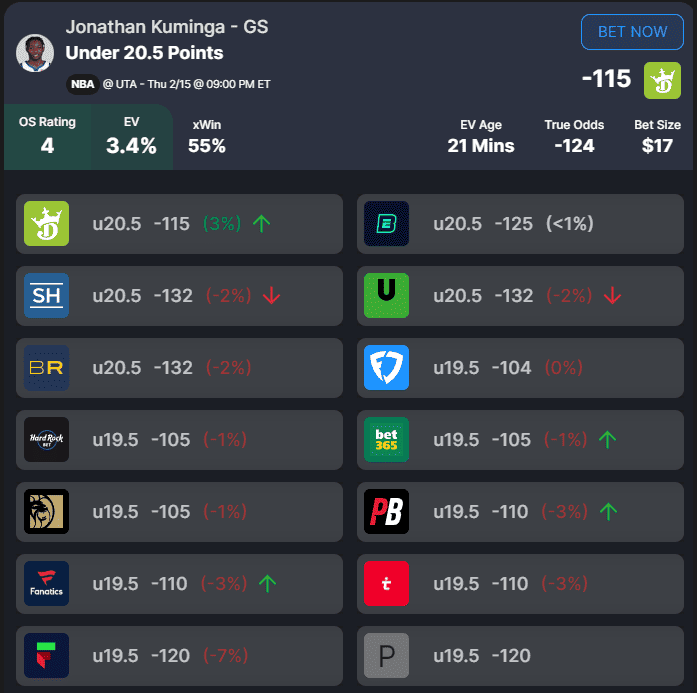
But knowing which books are sharper than others — and knowing at what point your edge overcomes the hold each book, even Pinnacle, is pocketing from your wager — can be difficult. That’s why Portfolio EV’s NBA betting model does the hard work for you. Let’s take a quick look at an example wager and how our product team describes each of the key terms.
Bet Size: The recommended bet size as a percentage of your bankroll. This metric is based on a fractional Kelly Criterion approach that leads to a reasonable balance of minimizing risk of ruin while maximizing potential reward.
EV: An abbreviation for “expected value,” this metric estimates the long-term profitability of a wager by taking into account the probabilities/payouts associated with each potential outcome.
xWin: The probability of winning the bet implied by the Sharp Sportsbook Algorithm true odds.
OS Rating: The OS rating provides a rating for each +EV bet. An OS rating above 20 signifies an exceptional bet. Ratings between 10 and 20 are highly favorable bets. Finally, a rating between 0 and 10 indicates a solid bet. We factor in the EV, expected win, bet size, and negative geometric drag to calculate this rating.
Hold: The synthetic hold across the entire market, which is the loss a bettor would sustain if he bet both sides of the market to win equal amounts. The larger the hold, the more difficult it is to beat that market.
True Odds: Odds that represent the real statistical probability of any outcome in a particular sporting event.
How to Use NBA Statistics in Player Prop Betting
Using Traditional Stats | Expert NBA Player Prop Advice
Traditional stats are the basis for almost all NBA player prop bets. You’re most often wagering on the total points, rebounds, assists, blocks, steals, turnovers or 3-pointers a player will record in a game — or some combination of those things. As a result, having a basic understanding of a player’s per-game average in those metrics is crucial. However, just because a player averages 25.5 points per game doesn’t always make the over 24.5 a sharp bet on the total points market. You must consider other factors that may affect a player’s per-game average.
Medians are a useful tool for evaluating a player’s per-game production, especially early in the year, when outlier performances carry more weight. Let’s say the aforementioned player has finished games with a total of 19, 20, 21 and 42 points. They may be averaging 25.5 points per game, but they have gone over the 24.5 only once. If, say, one of their teammates was out for that 42-point game, or the player just had a favorable defensive matchup, that per-game average of 25.5 means even less. Instead, the median — in this case, 20.5 — is a much better reflection of their per-game production.
Splits are another way to evaluate a player’s per-game production. I alluded to them above — things like a player’s minutes or defensive matchups are things we can “split” their production out to investigate. A player who is averaging 25.5 points per game on the year but who averages 20.5 points when playing between 20-29 minutes, their usual role off the bench, versus 30.5 points per game when playing between 30-39 minutes, their usual role as a substitute starter, is likelier to produce at the rate for the role they’re playing on the night in question. Other meaningful splits include opponents, home or away games and days of rest.
Using Advanced Stats | Expert NBA Player Prop Advice
There are far more numbers to consider than just what a player actually records in the box score, and some of these are called advanced stats. Some players are very efficient in limited minutes, while others are inefficient but get plenty of run. If you have a reason to believe that a player’s workload is going to change on a given night, understanding their efficiency can help you better project them in their new role. Efficiency doesn’t come down to just shooting percentages, although there are plenty of advanced shooting stats to consider — you can also measure how often a given player shoots, rebounds or dishes an assist for their team when on the floor.
Let’s start with some advanced shooting metrics. Effective field goal percentage adjusts a player’s shooting percentage for the value of the shots they take. While 3-pointers are worth more than 2-pointers, they’re also more difficult to make, so it’s important to adjust for players who make enough of their 3-pointers to be more or as efficient as guys who primarily make layups.
The formula is simple — it’s the sum of a player’s made field goals plus their made 3-pointers (which are divided by two) divided by their total field goal attempts. For example, although Steve Kerr was only a 47.9% shooter, his efficient shooting on the perimeter means that he owns an eFG% of 56.4%.
Now, let’s talk about rates. We can also measure the share of a team’s production a player is responsible for when they’re on the floor. Usage rate calculates the share of a team’s field goal attempts, free throw attempts and turnovers a player accounts for when on the floor and is great when trying to understand how often they have the ball in their hands.
Rebound rate measures the share of available rebounds a player grabs when on the floor, which can help you understand how important their contributions on the glass are to their team — and whether they’ll have an advantage against an opposing rebounder. Assist rate is calculated similarly, as are block rate and steal rate.
Using Tracking Stats | Expert NBA Player Prop Advice
Let’s wrap up with a final category of stats — those of the tracking variety. These can help you further understand a player’s efficiency and are good for evaluating whether a player has been getting lucky or unlucky. They can also help you understand the types of shots that a given player is attempting as well as the types of shots a defense is allowing. You can even see how effective players are when performing different types of plays, such as the roller in the pick-and-roll or as a driver.
I recommend that you explore the NBA’s array of tracking stats on your own, but I will elaborate on two metrics I like to use, potential assists and contested rebound rate, to evaluate player prop markets. Potential assists answer a simple question: how many assists could a player have generated in a game? The metric measures passes that result in a possession event, or a shot, foul or turnover. Players who are averaging close to the same number of potential and actual assists are generally getting lucky, while those whose actual assist numbers lag behind their potential assist numbers are getting unlucky.
It can also be useful to know how many rebounds a player has recorded that were contested — and how many chances a player had to record a rebound. Players who record lots of rebounds but have a low contested rebound rate are likely to struggle against a player who also records plenty of rebounds but with a high contested rebound rate. Further, rebound chances work a lot like potential assists, as you can see how many times a player is actually close enough to the ball to come down with a rebound per game.
How to Use NBA Injury Reports
While stats are useful, they aren’t the end-all, be-all of a projections-based approach to player prop betting. You must be able to understand the specific consequences of a player’s absence for both their team and the opposing team. For example, a Golden State Warriors team without Draymond Green will be easier to exploit offensively, but Green’s low usage rate means that his absence won’t create a ton of new scoring chances for the Warriors’ offensive weapons. However, his high assist rate means that his teammates may have more chances to dish out assists than they otherwise would.
Because so much NBA injury news comes out late in the day, it’s important to keep a close eye on teams’ injury reports and X throughout the day. If a key player is questionable, it’s often wise to wait before placing your NBA player prop bets on their teammates. That said, you can sometimes get an edge on the market if you can accurately predict whether a player will suit up. Some teams are relatively conservative when handing out questionable tags, for instance, and some players are likelier than others to suit up through injuries.
