Few sports provide more consistent action than baseball. Once the calendar turns to April, it’s pretty much wall-to-wall MLB action until the leaves change colors, and, by then, we’ve got football in full swing. If you’re looking to get some skin in the game, MLB pick’em sites like PrizePicks have plenty of offerings. But what is the best MLB PrizePicks strategy? Below, we’ll dive into my MLB pick’em expert strategy tips and advice, much of which involves using our PrizePicks Optimizer.
MLB PrizePicks Strategy: Expert Pick’em Tips & Advice
MLB PrizePicks Strategy: Expert Pick’em Tips & Advice
How to Find a Market-Based Pick’em Edge
If you’ve used a fantasy sports app before, you’re likely familiar with projections. Let’s say Jacob deGrom is on the bump. Whichever app you’re using tells you that he is projected for eight strikeouts, so you leave him in your lineup. That estimate is, generally, calculated with a combination of deGrom’s stats, his opponent’s stats and other factors. You could use that exact projection to justify adding deGrom more than 7.5 strikeouts to your lineup.
There’s a whole other way to find an edge — instead of using a projections-based approach, you can use a market-based one. The end goal is that we calculate the probability of an outcome, and we can use numbers at various sportsbooks — not pick’em apps like PrizePicks — to do so.
Let me demonstrate with an example square. PrizePicks has deGrom’s strikeout square set to 7.5. Meanwhile, Sportsbook A lists deGrom’s strikeout prop at 8.5 with the over priced at -145, and Sportsbook B has the same over priced at -150. Sportsbook C, which you know posts sharp lines because they take a massive handle while extracting relatively little hold, has the over 7.5 priced at -200.
The above market is a very inefficient one, and it’s one you could exploit to your benefit at PrizePicks. Let’s restate those numbers in sentence form to make this clearer:
- PrizePicks: deGrom has a 54.1% chance of recording at least eight strikeouts.*
- Sportsbook A: deGrom has a 59.2% chance of recording at least nine strikeouts.
- Sportsbook B: deGrom has a 60% chance of recording at least nine strikeouts.
- Sportsbook C: deGrom has a 66.7% chance of recording at least eight strikeouts.
*Implied probability at PrizePicks varies by the number of squares in your lineup.
From the above sentences, it should be clear that PrizePicks has made a mistake. The sportsbooks suggest a much higher chance of deGrom recording at least eight strikeouts than what PrizePicks would have you believe, making the “more” a sharp add to your lineup.
Using OddsShopper’s PrizePicks Optimizer to Find Market-Based MLB Squares
But breaking down the odds at every sportsbook is a lot of work, and it’s an unrealistic lift if you want to build multiple PrizePicks entries each day. So instead, why not have the hard work done for you with our PrizePicks Optimizer? To illustrate how it works, let’s look at an example:
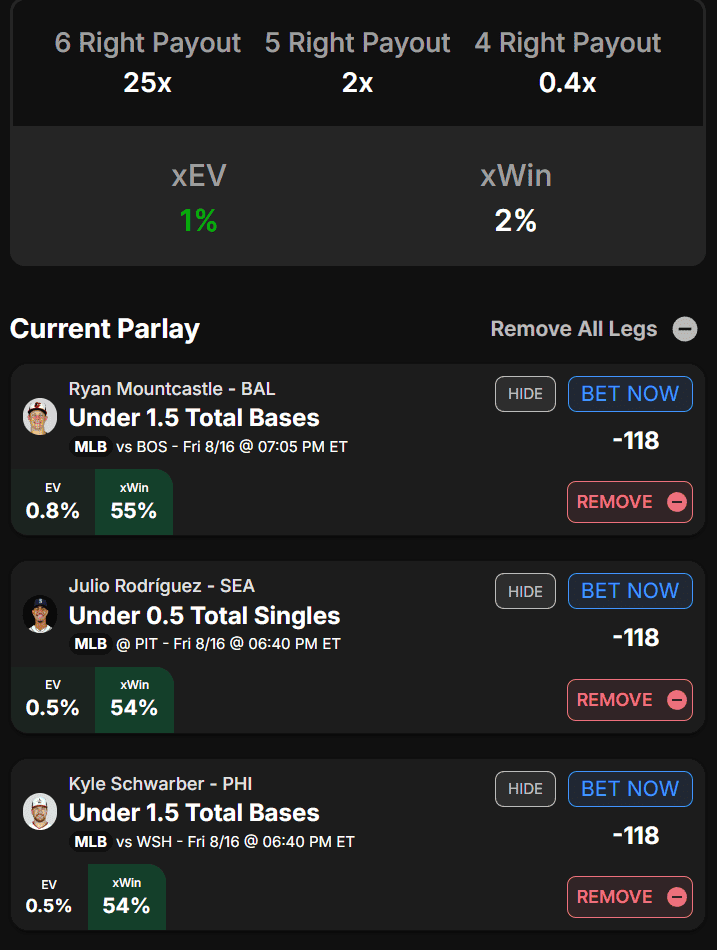
For this entry, I chose six squares, three of which you can see in the selected screenshot. Our PrizePicks Optimizer allows you to quickly find +EV pick’em plays, but you can also add legs you’re otherwise interested in to see how they’ll effect the overall +EV of the entry.
One of the keys to a successful MLB PrizePicks strategy is to build entries with more legs, not fewer. By doing so, you increase your multiplier, which lowers the number of times you must win to be profitable over the long term.
For example, an entry with three squares would pay out 2.25x (with two correct paying 1.25x), requiring each individual square to win 59% or more of the time for you to be profitable. In contrast, a six-square entry would pay out 25x (with payouts for five and four correct), requiring each square to win only 54% of the time.
That 5% difference may not sound massive, but over the long term, it certainly can be. Said another way, you need to win at least one out of every 2.25 three-square entries to be a profitable PrizePicks player, but you only need to win one out of every 25 six-square entries to be one.
MLB PrizePicks Strategy: Finding a Projection-Based Pick’em Edge
Using Traditional Stats | MLB PrizePicks Strategy Tips & Advice
The most basic way to create an MLB player projection comes down to simply using a player’s traditional stats. Of course, baseball is a bit different than usual in that the opportunities a player may get to record an actual stat will vary per game. For example, a player playing for a home favorite may only have eight innings to record at-bats. Likewise, a starting pitcher lining up against a low-quality opponent may stick in the game longer, giving him more chances to record strikeouts.
Batter PrizePicks Squares
Let’s go through a few popular types of MLB PrizePicks squares to discuss how actual stats can be used to generate projections. Hits are a pretty simple one. The go-to traditional statistic for hits is a player’s batting average, which calculates their hits per at-bat. If we can estimate their total at-bats, we’ll have a good sense of their probability of recording a hit. Importantly, not all plate appearances count as at-bats — sacrifices, walks and HBPs all don’t count. So how can we best estimate a player’s total at-bats?
We can start by establishing a floor for their possible number of plate appearances. A batter in the first two-thirds of the order for a road team (or the first third for home teams) must record at least three plate appearances per game unless substituted out. Players outside those parts of the order must record at least two.
Now that we’ve established a floor (and since we can’t establish a hard ceiling), let’s work to develop a rough projection. In 2023, Shohei Ohtani started 135 games, recorded 599 plate appearances, 497 at-bats and 151 hits. That means averaged 4.4 plate appearances per game, 82.9% of which were at-bats, and recorded a hit 25.2% of the time, slightly lower than his batting average of 30.4%.
If Ohtani were in the top third of the order at home, at those rates, he would have at minimum a 72.6% chance of recording at least one hit. With an extra plate appearance, that would tick up to 100.8%; with five plate appearances, 126%. However, while it’s highly probable that Ohtani will get a hit, let’s not forget that he went hitless in 37 of his 135 games (27%). For a more accurate projection, you’d want to factor in stats like hits allowed by the opposing pitcher, so let’s talk pitching next.
Pitcher PrizePicks Squares
Next, let’s discuss strikeout squares. Strikeouts per nine innings (K/9) is a traditional stat often used in conversation about how effective a pitcher is at punching out opposing batters. This metric is a bit easier to use for our purposes than, say, batting average, as we need not filter out plate appearances. However, we still need to project just how many opportunities a pitcher will get to record strikeouts.
While we don’t have an easily calculated floor, we do have a rough ceiling: 27 outs for home pitchers and 24 outs for road pitchers. That number doesn’t count extra innings, but starting pitchers rarely stick around for extra baseball. Further, only the most efficient pitchers have a chance to make it through that many outs — most will get pulled at around the five-inning mark.
You can keep track of a pitcher’s per-game volume with several traditional stats, all of which can help you make projections. Pitch count, innings pitched and batters faced are all different stats that offer insight into how long a pitcher can stick in a game. Further, the quality of an opposing offense can cause a pitcher to get knocked out of the game early or stick around until late.
You’ll also need to estimate a player’s efficiency, which, just like everything else, will be affected by the quality of an opposing offense. Let’s use Clayton Kershaw for this example.

In 2023, Kershaw started 24 games, pitched 131.2 innings and averaged 9.4 K/9. If he pitched his usual 5.5 innings and struck out batters at his usual clip, he would have racked up 5.7 strikeouts. But if you expected Kershaw to pitch a little longer, say, 6.1 innings, that number would tick up to 6.6.
Using Expected Stats | MLB PrizePicks Strategy Tips & Advice
Traditional stats are great to give you a rough estimate of how much of a relevant stat a player produces. That’s especially helpful because most MLB PrizePicks squares are about traditional stats — you’re likely taking a player’s hits, strikeouts or total bases, not their expected batting average (xBA). But expected stats like xBA may actually offer more insight into a player’s production than hard counting stats, especially since they allow us to compensate for the consequences of variance.
Let’s start by discussing xBA and expected slugging percentage (xSLG). These metrics are great for both hit and total base squares as they give you a more accurate estimation of what a batter should be doing based on their peripheral stats. Statcast uses numbers like exit velocity and launch angle to estimate the probability of a given batted ball becoming a hit (hit probability) — and the probability of it generating extra bases — to calculate a player’s xBA and xSLG.
Those metrics can also be used to calculate expected stats for pitchers. There are a few extra steps, of course — we need to arrive at expected weighted on-base average (xwOBA), which isn’t as helpful for batters as walks don’t count as total bases. Once we’ve got xwOBA, it’s possible to generate a pitcher’s expected earned run average (xERA), which can help us estimate how many outs they should be around to produce.
We can also use the above information to calculate both expected home runs (xHR) and xHR allowed. These metrics are incredibly useful for prospective home run square players, as batters who play in pitcher-friendly parks may have artificially deflated home run numbers, while pitchers who play in those same parks may be getting overrated due to the favorable conditions from which they benefit at home.
Using Splits | MLB PrizePicks Strategy Tips & Advice
Splits are another source of valuable information when looking for good MLB PrizePicks squares. Whether they’re home and road splits or handedness splits, they can help you understand when a batter has an edge versus a given starting pitcher — or when a pitcher tends to step up in the strikeout department. Let’s get into the top splits I consider as part of my MLB PrizePicks strategy:
Handedness splits: The nature of baseball makes paying attention to handedness important. Generally, hitters perform best against opposite-handed pitchers. That isn’t always true — for example, Freddie Freeman slashed .335/.399/.609 against same-handed pitchers versus .330/.414/.548 against opposite-handed ones. Freeman’s splits speak to the importance of knowing whether your targeted player performs better against a certain type of pitcher because there are exceptions to the rule.
Home and road splits: Also called home and away splits, these splits give us insight into how a player performs in front of a friendly crowd versus an unfriendly one. There are more factors baked into home and road splits, like travel, routines and more, which is why they’re so valuable. However, they’re somewhat subsumed by park factors, which we’ll get into below — a hitter who plays home games in a hitter-friendly park is likely to perform worse on the road.
Timing splits: Whether on a month-by-month, week-by-week or pre- or post-All-Star Break basis, timing-based splits can give you insight into a player’s recent form. Some batters are streakier than others — to revisit our Freddie Freeman example, he started the year in poor form by slashing .292/.377/.451 but turned things around in May by slashing .400/.462/.722.
Park Factors | MLB PrizePicks Strategy Tips & Advice
Park factors help you understand the batted ball outcomes of a given ballpark. Obviously, a high-elevation stadium like Coors Field is conducive to more extra-base hits, and we can track them with data from Statcast. Let’s take a look at the friendliest parks for batters, per their rolling three-year average:
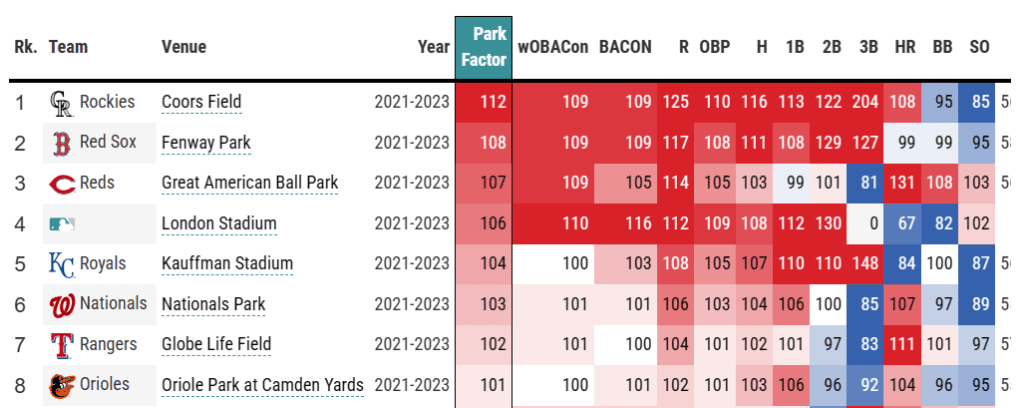
Hitters playing Coors Field, Fenway Park and Great American Ball Park see the greatest gains, per Statcast. Notably, that doesn’t mean all types of hits are distributed equally — home runs are far more common at Great American Ball Park than at Coors Field or Fenway Park. Conversely, doubles and triples are far rarer at that park than at Coors or Fenway.
The sportsbooks know to consider park factors when setting their lines, but one-off games at places like the London Stadium can sometimes catch both them and pick’em sites like PrizePicks off guard. Still, understanding park factors is a meaningful way for you to find an edge — or at least to understand why a PrizePicks MLB square is set to where it is.
Another part of park factors: the weather. Humidity and warm temperatures can help the ball travel further. The wind can help, too — if it’s blowing out. If the wind is blowing in, it can hurt. Make sure to check our MLB weather report for today’s conditions!
OddsShopper’s MLB Tools & Tips
Looking for more MLB predictions? OddsShopper’s experts are here to break down this MLB season — make sure to check out the rest of our MLB betting articles. Still need more picks? Subscribe to OddsShopper’s +EV tools for the best +EV MLB bets today.