So you want to start betting on NHL player props — or maybe you want to start actually making money on your NHL player prop bets. You’ve come to the right place. Let’s break down how to bet on NHL player props profitably by talking about the strategies the sharps are using to build their bankrolls. If this story doesn’t answer all your questions, we have other Betting 101 posts for you to check out. Make sure to check out our NHL betting tools or our NHL betting articles as well! Anyway, let’s talk about how to bet on NHL player props as I dish out my tips, strategy and expert advice.
Portfolio EV, our sports betting model, went 8,531-7,813 (6.1% ROI) on all +EV NHL bets with an OS Rating of 2 or higher last season. Click here to get it for free just by signing up with a partner site!
How to Bet on NHL Player Props: Tips, Strategy & Expert Advice
How to Bet on NHL Player Props
There are two ways to go about betting on NHL player props (or, really, betting on anything): projections-based and market-based systems. You’re probably familiar with projection-based systems if you’ve played fantasy hockey before — projection-based systems rely on players’ statistical profiles to estimate how much they’ll produce in an upcoming game. We’ll talk about both approaches in this article, but before we get into some of the best methods to make projections, let’s talk about Portfolio EV’s market-based approach.
How to Use Portfolio EV
So if we are not relying on projections to guide our NHL player prop bets, what are we using? It’s quite straightforward: the betting market. Instead of analyzing Connor McDavid’s recent games, we can seek an advantage by examining the odds offered by various sportsbooks for him to score a goal, take a certain number of shots or record an assist.
In essence, there are two primary strategies for those aiming to excel in NHL player prop betting: a projection-based approach or a market-based approach. What’s advantageous about the latter method is that it doesn’t demand an in-depth understanding of hockey; you just need to grasp how sportsbooks function. Both approaches estimate the chance a given bet has of winning to help us identify wagers with positive expected value, or +EV.
A market-based approach operates on the premise that certain odds — and consequently, some sportsbooks offering those odds — are sharper than others. Sportsbooks known for their lower hold and high betting limits, such as Pinnacle, are more vulnerable to losses from inefficient lines, incentivizing them to be sharper. This suggests that if Pinnacle offers the over 1.5 for Sidney Crosby’s total shots on goal at -150, while another bookmaker sets the same line at +150, the over is likely a sharp play at the public book.
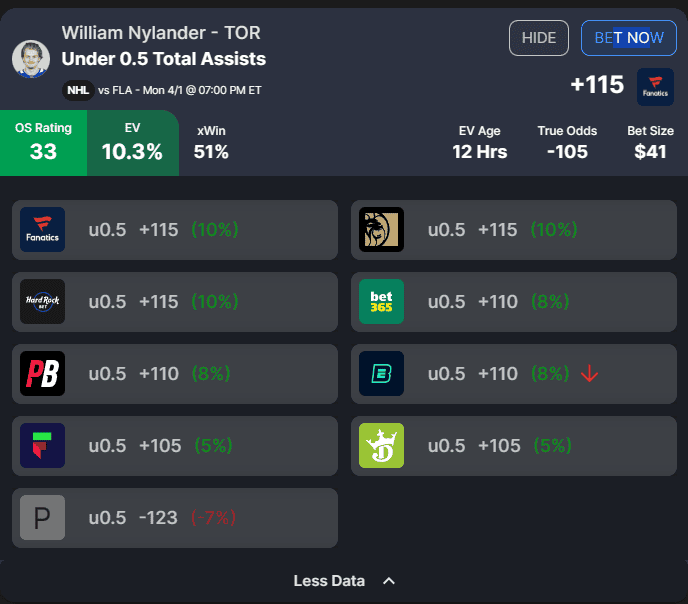
However, discerning which sportsbooks offer sharper odds and determining when a bet provides sufficient edge to be deemed +EV can be challenging. This is precisely why our betting model exists — it does the hard stuff for you. Let’s examine an example wager and how our product team defines the relevant keyterms.
Bet Size: The recommended bet size as a percentage of your bankroll. This metric is based on a fractional Kelly Criterion approach that leads to a reasonable balance of minimizing risk of ruin while maximizing potential reward.
EV: An abbreviation for “expected value,” this metric estimates the long-term profitability of a wager by taking into account the probabilities/payouts associated with each potential outcome.
xWin: The probability of winning the bet implied by the Sharp Sportsbook Algorithm true odds.
OS Rating: The OS rating provides a rating for each +EV bet. An OS rating above 20 signifies an exceptional bet. Ratings between 10 and 20 are highly favorable bets. Finally, a rating between 0 and 10 indicates a solid bet. We factor in the EV, expected win, bet size, and negative geometric drag to calculate this rating.
Hold: The synthetic hold across the entire market, which is the loss a bettor would sustain if he bet both sides of the market to win equal amounts. The larger the hold, the more difficult it is to beat that market.
True Odds: Odds that represent the real statistical probability of any outcome in a particular sporting event.
How to Use NHL Statistics in Player Prop Betting
Using Traditional Stats | Expert NHL Player Prop Advice
If you’re hoping to develop NHL player prop projections or estimates, you’re necessarily dealing with a player’s traditional stats. Most NHL player prop markets are centered on various traditional stats like points, goals, assists, shots or blocked shots.
However, simply looking at a player’s average and betting based upon that is shortsighted. A player’s opportunities to record stats can fluctuate from game to game. For instance, opponent quality may come into play, as a player on the top line may see less action in a blowout; conversely, a goalie playing a top-shelf opponent may get pulled.
Player Props for Forwards, Centers, Wings & Defencemen | Expert NHL Player Prop Tips & Advice
Let’s talk about one specific type of NHL player prop as an illustration: points. In the NHL, players receive a point for any goal or assist they record. We can look at the points a player averages per game when projecting their next one — or we can get a bit more granular and dive into how many goals (usually called anytime goalscorers) and assists they average separately. Other common markets for offensive skaters include shots, shots on goal and blocked shots.
It’s also more beneficial to understand how much a player contributes per minute than per game, too, because a player’s minutes will vary on a game-by-game basis. While a bad opponent may help a player average more points per minute, they may play fewer minutes as a result, limiting their chances of actually recording that point.
For example, let’s say Connor Bedard averaged 0.9 points per game on 20 minutes of ice time. That’d give him 0.045 points per minute. Suppose he was getting ready to play what was projected to be a close game, which we can figure out from the puck and money line. In that case, it’d be fair to pencil him in for an above-average amount of time on the ice — say, 22 minutes — which increases his odds of actually tallying a point.
Beyond a player’s production, you should also try to understand the production that the defense they’re playing gives up. You can do so simply by looking at the overall goals and assists allowed per game by opposing defense, or, again, you can get a bit more granular and look at their goals allowed by position or their
For example, as of April 2, 2024, the Chicago Blackhawks had allowed the second-most goals per game (2.5). Their worst ranking on a positional basis was 29th versus centers. They even ranked 11th-best versus defencemen! Blindly backing an opposing star player to score a goal versus the Blackhawks may not be as efficient as specifically targeting a center.
Player Props for Goaltenders | Expert NHL Player Prop Tips & Advice
You can also bet on a variety of goaltender stats, including saves and goals against. Let’s talk about saves here — as with props for offensive skaters, you can calculate both the per-game average for a goalie and their per-minute average. The per minute average is just as important for goaltenders because they can get pulled deep into games, so you may not be dealing with a flat 60 minutes versus every opponent.
You’ll also want to consider the offensive production of your selected goaltender’s opponent. Goalies can’t get saves if the other team isn’t taking shots on goal, so it’s important to have a sense for how many save opportunities a goalie may have. For example, a high-quality goaltender like Juuse Saros may average 25.8 saves per game and 0.46 saves per minute, but he’ll struggle to replicate that production against a tier with a bad offense like the 2023-24 San Jose Sharks.
So how do you evaluate the quality of an opposing offense? You could look at their total shots on goal or their average shots on goal per game. As of April 2, 2024, the Sharks were averaging just 25.5 shots on goal per game, which ranked dead last.
You can also look at more advanced metrics like Corsi (which measures a team’s share of all shot attempts) and Fenwick (which measures a team’s share of all unblocked shot attempts) to get a better sense of possession. The Sharks also ranked last in both Corsi (44.3%) and Fenwick (43.7%), demonstrating just how bad their offense would be at generating save opportunities for Saros.
Using Expected Stats
Traditional stats tell you what happened in a given game, but they don’t tell you what should’ve happened. Have you ever seen an incredible save that may have changed the outcome of a game (or your bet) like this one by Saros? How about a botched shot that should’ve been a goal? We can use advanced stats to correct for those high-variance outcomes to ascertain when players may be performing way above or way below where they should be.
To illustrate this point, let’s look at the NHL’s leaders in goals saved above expected. Winnipeg’s Connor Hellebuyck was leading the metric as of publication with 28.5 goals saved above expected (GSAE) this year, good for 0.52 per game. While there is some year-to-year predictability with GSAE, spectacular saves are often products of variance. Hellebuyck ranked fourth in total GSAE in 2022-23 and averaged 0.49 per game. He ranked eighth in 2021-22 and averaged 0.26.
I recommend looking at a goalie’s historical production in GSAE before choosing to fade them because of overperformance, but
A bettor eager to fade Hellebuyck’s unsustainably hot goaltending would be wise to do so — with Hellebuyck averaging 27.4 saves per game and 0.5 of those arguably attributable to variance, getting him to stay under the 27.5 may prove sharp when other conditions are favorable. The inverse could be true for a goalie with negative GSAE, as they’re likely to benefit from variance at some point.
Using Line Data & the Power Play
One piece that renders hockey distinct from other sports is the power play. While in soccer, teams can sometimes be forced to play down a player after a red card is given out, that’s relatively rare, and the consequence of being without a player is less significant since there are still 10 others on the pitch.
But in hockey, the power play routinely forces teams to play down or up a player, which often leads to goals, assists, shots and points. Another layer to this is that teams can make additional substitutions to exploit the power play, leading to the uneven distribution of these scoring opportunities to the top power-play unit.
When wagering on NHL player props, it’s important to understand how often a given team fouls (and therefore gives up a power-play opportunity) and how efficient those teams are at the penalty kill. It’s also important to know who is on your chosen team’s power-play unit — backing a second-line player versus a shaky second line could be smart, but if they’re not on the power-play unit, their chances of exploiting that advantage could be reduced
Likewise, fading an efficient scorer against an efficient goaltender could prove sharp, but if the efficient goaltender plays for a team that commits loads of fouls and struggles on the penalty kill — and the efficient scorer is on the power play unit — you’re incurring some additional risk that full-game averages may not reveal to you.
Using Injury Reports & Goaltender News | Expert NHL Player Prop Tips & Advice
Injury and goalie news combine to add another wrinkle to NHL player prop betting. While you can generally trust probable goaltender information, it isn’t perfect, and as in baseball, teams aren’t required to start their probable starters. Betting on NHL player props early means you incur some risk if, say, your player is moved to the second line or the team you’re fading opts to start their best goalie, not the struggling backup you were hoping to fade.
However, if you wait too long, you may not beat the market or other sharp NHL player prop bettors, so you’re also incurring risk by sitting on the sidelines. It’s a delicate balance, and perhaps the best way to swing it is to accept that you may have to hedge out of some plays. While you’re losing money by swallowing the juice in those cases, it’s often a better choice than losing your full stake.
While goaltender news and injury reports can be frustrating, they can also be an opportunity. If you can find out information before a book adjusts, that’s a meaningful edge you can exploit. Portfolio EV is quite helpful in this regard, as it can help you find off-market numbers that may be a product of late-breaking developments.
Portfolio EV NHL Player Prop Expert Tools & Tips
Looking for more NHL betting advice? OddsShopper’s experts are here to break down this NHL season — make sure to check out the rest of our NHL articles. Still need more picks? Subscribe to Portfolio EV for our market-based betting model’s picks and best bets.

